Quantcast
Channel: Enterprise Manager
Viewing all 63 articles
Browse latest View live

AWR Warehouse in EM12c, Rel 4, Part II

$
0
0

So, there is a lot to cover on this topic and I hope Part I got you ready for more!  Part II, I’m going to cover the following areas of the AWR Warehouse:

  • Installation
  • Access
  • ETL Load Process

Installation

Let’s start with Prerequisites:

  • The AWR Warehouse Repository must be version 11.2.0.4 or higher.
  • The Targets and I think this will get a few folks, need to be 12.1.0.2 or higher, (now folks know why some docs aren’t available yet!:))
  • Just as with installing ASH Analytics, etc., make sure your preferred credentials are set up for the database you plan to use for the AWR Warehouse repository.
  • You should already have your database you plan on using for the AWR Warehouse repository discovered in your EM12c console.
  • Any database targets you wish to add at the this time to the AWR Warehouse setup should also be pre-discovered.
  • For a RAC target or AWR Warehouse, ensure you’ve set up a shared location for the ETL load files.

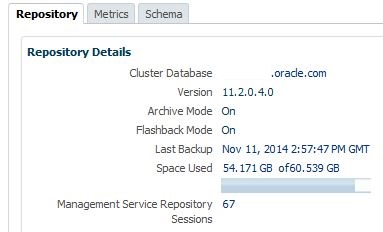
Now the repository is going to require enough space to receive anywhere from 4-10M per day in data, (on average…) and Oracle highly recommends that you don’t run anything else on the AWR Warehouse database, so don’t use your current EM12c repository database or your RMAN catalog, etc…  Create a new repository database to do this work and manage the data.

To Install:

Click on Targets, Databases, which will take you to your list of databases.  Click on the Performance drop down and choose AWR Warehouse.  As no AWR Warehouse has been set up, it will take you promptly to the wizard to proceed with an initial workflow page.

Click on the Configure option and choose the database from your list of available databases to make your AWR Warehouse repository database. Notice that you next need to select Preferred Credentials for both the database target and the host it resides on.  As the ETL process does perform host agent host commands, both these credentials are necessary.

Next page you’ll set up the retention period for your AWR Warehouse.  You can set the value to number of years or choose to retain the data indefinitely for you data hoaders… :)  You can then set the interval to upload data, (how often it processes the ETL load…) which defaults at 24hrs, but you can set it as often as once per hour.  Due to potential server load issues considering size of environment, # of targets, etc., I would recommend using the default.

Next set up the location for the ETL dump files.  For RAC, this is where you will need to specify the shared location, otherwise, for non-RAC environments, the agent state directory will be default.  I recommend setting up an exclusive directory for RAC and non-RAC targets/AWR Warehouse.

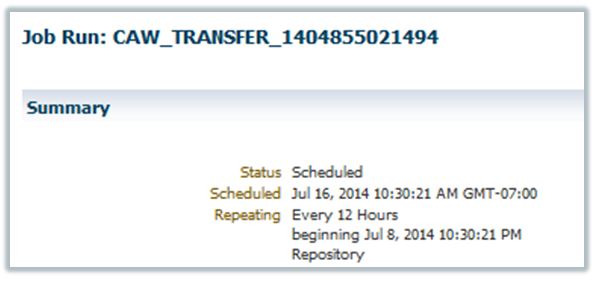
Click on Submit and monitor the progress of the deployment in the EM Job Activity.  The job will be found quickly if you search for CAW_LOAD_SETUP_*.

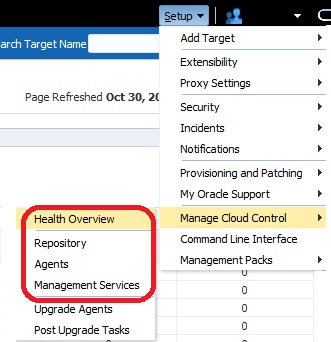
Accessing the AWR Warehouse

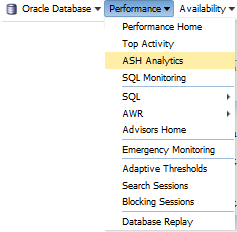
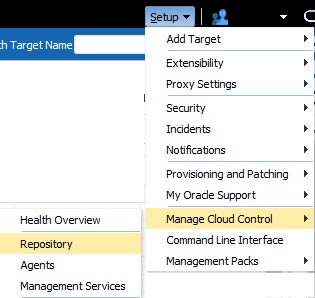
Once set up, the AWR home can be accessed from the Targets menu, click on Databases, then once you’ve entered the Databases home, (databases should be listed or shown in a load map for this screen, click on Performance and AWR Warehouse.

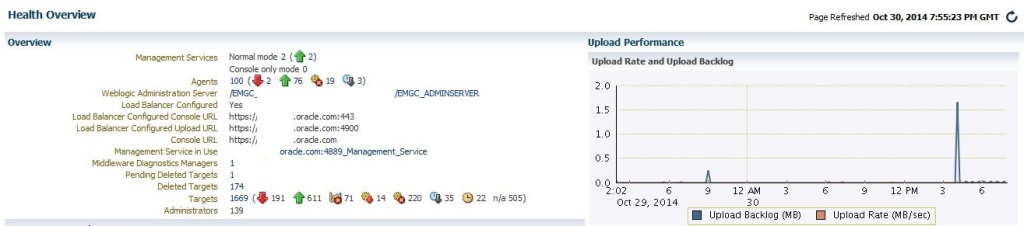
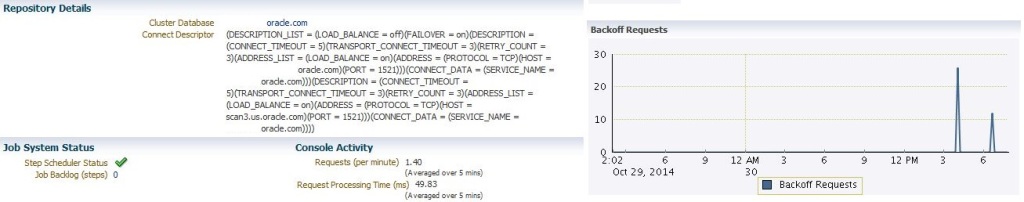
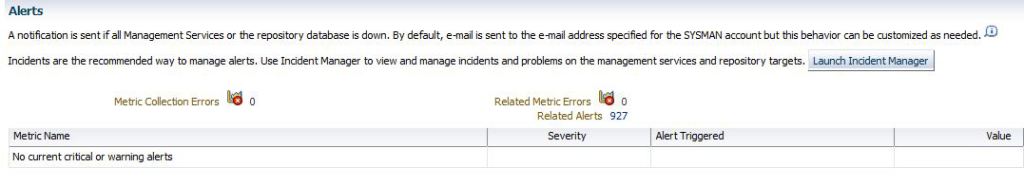
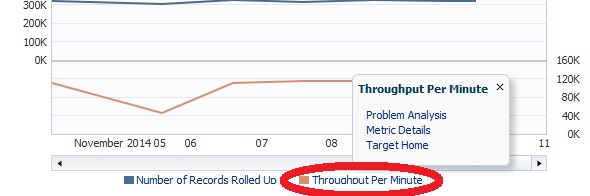
The following dashboard will then appear:

awr_ware_3

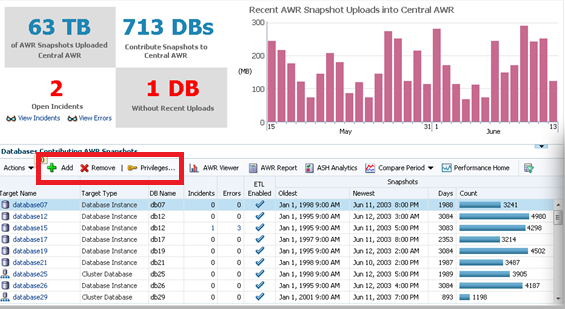
From this dashboard you can add or remove source targets and grant privileges to administrators to view the data in the AWR Warehouse.

You can also view the AWR data, run AWR reports, do ADDM Comparisons, ASH Analytics and even go to the Performance home for the source target highlighted in the list.

awr_ware_4

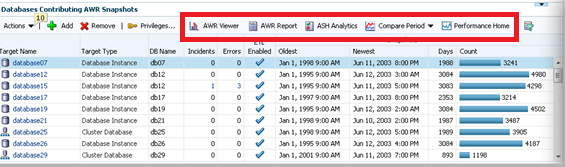
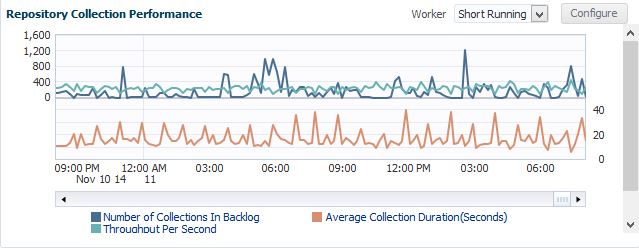
Note for each of the databases, you can easily see the Source target name, type, DB Name, (if not unique…) # of Incidents and Errors.  You can see if the ETL load is currently enabled, the dates of the newest and oldest snapshots in the AWR Warehouse and the # of AWR snapshots that have been uploaded to the repository.

Now how does this all load in?

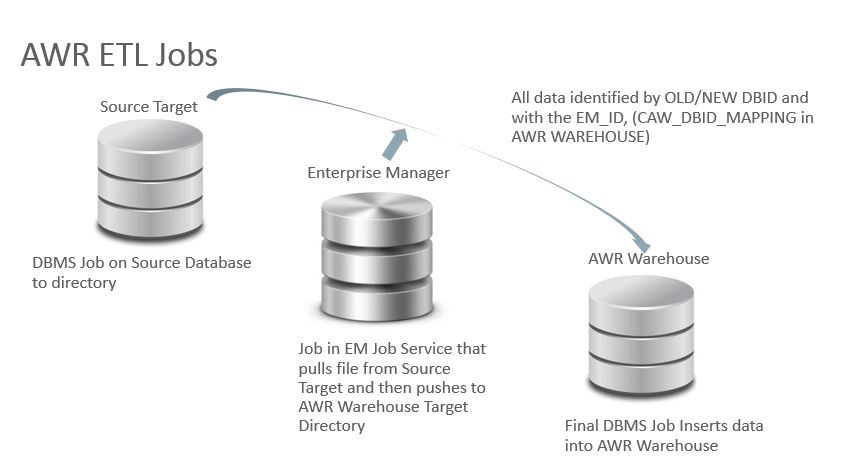
The AWR Warehouse ETL

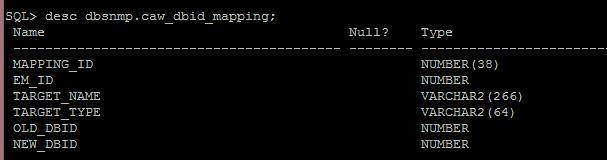
The process is actually very interesting.  Keep in mind.  These are targets, source and destination, but what will drive the ETL job?  How will the job be run on the targets and then to the destination AWR warehouse?  Now I was sure the repository used TARGET_GUID to keep everything in order, but since the ETL does have to push this data from a source target through to the destination repository via the host, there is definite use of the DBID, too.

To upload the AWR snapshots from the target to the AWR warehouse, an extract is added with a DBMS job as part of a new collection on a regular interval.  There is first a check to verify the snapshot hasn’t been added to the warehouse repeatedly and then the extract is identified by DBID to ensure unique info is extracted.

The second step in the ETL process is the EM12c step.  Now we are onto the EM Job Service and it submits an EM Job on the host to transfer the data from the target to the warehouse host for the third part of the ETL process.  This is an agent to agent host process to transfer the dump files directly from target host to AWR warehouse host, so at no time do these dump files end up on the EM12c host unless you were housing your warehouse on the same server as your EM12c environment.

The last step for the ETL process is to then complete the load to the AWR warehouse.  This is another DBMS job that takes the dump files and imports them into the AWR Warehouse schema.  DBID’s are mapped and any duplicates are handled, (not loaded to the final warehouse objects…)The ETL is able to handle multi-tenant data and at no time is there a concern then if more than one database has the same name.

Retention Period

Once the retention period has been reached for any AWR warehouse data, the data is purged via a separate job set up in EM12c at the time of creation, edited later on or set with the EM CLI command.  A unique setting can be made for one source target from another in the AWR Warehouse, too.  So let’s say, you only want to keep three months of one database, but 2 years of another, that is an option.

For Part III, I’ll start digging into more specifics and features of the AWR Warehouse, but that’s all for now!


Tags:  

Del.icio.us
Facebook
TweetThis
Digg
StumbleUpon


Copyright © DBA Kevlar [AWR Warehouse in EM12c, Rel 4, Part II], All Right Reserved. 2014.

The *New and Improved* Extensibility Exchange is Here!

$
0
0

How many of you use Oracle Enterprise Manager 12c, recognize it can do so much more than just taking it out of the box and plugging it in, then proceed to start building metric extensions, plug-ins, writing EM CLI scripts, etc? How cool would it be if you could peruse a library of plug-ins to support the extensibility framework for you to check out and use for the benefit of your company and you?

If you aren’t familiar with the Extensibility Exchange, it is exactly that! Oracle’s Extensibility Exchange is a library of contributions from Oracle, it’s trusted partners and power users. The interface is simple to use and we’ll go through how to use it and how to also become a contributor, as I’m one who believes in giving back to the Oracle community!

Accessing the Extensibility Exchange

Once you enter the site, you will first see the main page.  Note the header has great information on upcoming events for the Enterprise Manager community, including free training and webinars, along with a link if you want to get more info or register for an event:

EE_11

Below are the categories involved in the Extensibility Exchange site.  These are arranged by number of content and views, so you can get a sense of what extensions are most popular.

Below that is the Search option that is incredibly helpful and easy to use. Simply type in a keyword and the search option goes to work to find you all plug-ins in the Exchange that contain that word.

EE_6

From the lower half of the page, you can also peruse the recently updated extensions in the library by Oracle, by partners and also by “tags”.  Social media options are also available if you want to follow the latest from Enterprise Manager.

Now lets go back to the Search bar and talk about how to use the Extensibility Exchange in the search for an extension in the library:

Search

Simply start to type in the keyword of what you are searching for, in our example, we’ll search for “Exadata”:

EE_2

As you can see, the keywords for Exadata show up immediately.  For our example, we’ve chosen “Exadata Database Machine”.

This takes us to the page for the extensions that match our search we chose from the drop down:

EE_3

Extension Interface

By clicking on one of the extensions found in a search, we are taken to the content details for the Exadata Storage Server plug-in:

EE_4

Notice that you can read the full documentation on the plug-in, (Explore Plug-in), Download it, Report a problem if one is experienced with the plug-in or Bookmark it for later reference via a web browser.  I also recommend, if you do download it, definitely return to the plug-in and rate it, along with letting others know if you would recommend the plug-in.  It’s very valuable to other users of the Extensibility Exchange to receive your feedback.

If you choose to download a plug-in and it’s from Oracle, it will take you to the Oracle download page:

EE_5

You can simply accept the license agreement and click on the Download option to get your plug-in and proceed to reap the benefits from designing and coding you didn’t have to re-invent! :)

Partners Extensions

Now no need to just use Oracle’s Offerings.  Let’s say you find a plug-in that does what you need from one of our valued partners.

EE_7

For our example here, we’ll use the “Monitoring Essentials” plug-in added to the library by Apps Associates.  All the same options are offered down the left side of the pane, including documentation to review before deciding to download it, along with the ability to report problems and to provide feedback and rate the plug-in.

If you were to choose to download this great partner plug-in, you’d be promptly forwarded to their download site, as partner extensions, logically, aren’t stored with Oracle’s offerings.

EE_8


 Classic View

Now, if for some crazy reason, you preferred the older look of the Extensibility Exchange, you do have the option to click on the Classic tab at the top of the page and you can revert to the previous iteration of this great web site.  I’d recommend working with the new version, though.  The enhancements will quickly become apparent!

Development Resources

Now lets say you’ve been working hard on your own metric extensions, plug-ins and other valuable additions to your EM12c environment and you’d like to learn more.  The Development Resources page is for you.  The page includes downloads for kits, guides, white papers and screenwatches to make it easy for you to become an EM12c Extensibility Expert!

Contribute

If you want to add your contributions to the Extensibility Exchange, it’s just a matter of filling out the form on the Contribute page and click on Create.  Oracle will take it from there and work with you to validate your contribution and then add it to the Extensibility Exchange catalog.

At a Glance

Now this may be the last tab, but it’s also one of the most important.  The At a Glance page gives a quick view of what plug-in offers what functionality.

EE_9

It also has a cool search features, so you can add filters, then compare the feature offerings from different plug-ins:

EE_10

For our example, we did a quick search on EMC plug-ins and notice, there are two that provide “out of the box” reports, so if that is a requirement of the plug-in your need, here’s two options you can download!

Summary

All in all, I love the Extensibility Exchange and can’t wait to see EM CLI scripts, metric extensions and other offerings added to this great update to the site!


Tags:  

Del.icio.us
Facebook
TweetThis
Digg
StumbleUpon


Copyright © DBA Kevlar [The *New and Improved* Extensibility Exchange is Here!], All Right Reserved. 2014.

EM12c Rel. 4, the Security Console

$
0
0

Why is the Security Console an important new feature?  I was contacted by three people just this last week on how to secure an EM12c environment.  How many of you are still logging in to the EM12c console or CLI with the SYSMAN account?

Bad DBA, BAD!!  :)

bad_puppy_1

Security Console

The Security Console helps the administrator set clear expectations for security standards for database administration and EM12c environment security.  It provides read only dashboards that clearly show security violations and status, along with steps to secure the EM12c environment.

You can access the Security Console for EM12c via the Setup Menu, Security and then Security Console. Now unlike other “consoles”, the Security Console is more of a review “report” of your environment with tabs providing data breakdown and discussion of best practices for the EM12c.

em_security_1

Once you get into the “Console”, it will take you through what, may for some, look like you haven’t set it up, but you are where you are supposed to be!

The left side is going to show you a menu of links that can take you through the console/report:

EM_sec_4

The Overview explains how the console works and what data you will find in each of the links below it.

Each link has at least two tabs, one for an Overview of the section and then the results or Configuration:

em_Sec_5

Pluggable Authentication

So if we start with the first category after the Overview, the Pluggable Authentication Overview is displayed.  The overview for this category will tell you about Repository-Based Authentication, (your default option for any EM12c repository) Oracle Access Manager, (ACM) which is a single sign-on method for Fusion Middleware and becoming more popular as of late, Oracle Application Single Sign-on method, Enterprise User Security Authentication, (EUS) which is an LDAP compliant Enterprise Manager solution for single sign-on and last, but not least, standard LDAP authentication through Oracle Internet Directory, (OID) or Microsoft Active Directory.

As authentication is of dire importance to your business, (it is how you are validating access to your Enterprise Manager and if not managed correctly, could inadvertently grant access to a company’s and/or customer data) knowing who has what profiles assigned to them in the EM12c environment is important, too.

The Configuration tab for Pluggable Authentication not only displays high level information about who has what profiles assigned in the repository, you can also click on the Details information to display the information about the profiles shown.

em_sec_pd

FIne-Grained Access Control

Fine-Grained Access Control has a number of tabs:

em_sec_6

The section of the console covers information about the Repository owner, (SYSMAN) along with administrators and super administrators.  It also covers privileges, roles, including out of the box and ones created to support your EM12c environment.  It also provides information privilege propagation in aggregates so you can quickly assess security risks from this feature as well.

Administrators

Knowing who your Super Administrators are is important and in a large EM12c environment, where you could have 100s of users, this could be a daunting task to scan lists of names looking for those with the assignment of Super Administrator

em_sec_admin1

You’ll not only see a list of Super Administrators, you’ll also see the last time they logged into the repository, this could mean either the console or the EM CLI, by the way and that the SYSMAN account was logged into one today, June 9th, (bad DBA, BAD!! :))

em_sec_admin1

We can click on the icon at the top of the Username list, which when you hover, says, “Query by Example” and then you can do a search for either Username or Last Authenticated Time.  In the example below, I can do a quick search for me in the list and it comes up promptly with the right info:

em_sec_admin2

Privileges

Privileges will grant us a view into who has what privileges in the repository and console. The top section of the console displays each user and quantity of privileges assigned:

em_sec_priv1

There is also a note that these privileges should be considered for a role, granting them in a more efficient and secure manner.

The second section focuses on Target privileges and what the privilege does.  If you hover over the Privilege type, you find out if the privilege is assignable to an individual target or can be assigned to all targets of that type/class of targets.

em_Sec_priv2

If you’re having trouble viewing the screen and would prefer it full screen, you can click the Detach button, which will detach this section of the page and display it full screen, separate from the other aspects shown in the console.

The View drop down allows you a number of options.  It not only has a second opportunity to Detach the section from the screen.

em_Sec_priv3

From here, you can reorder or decide what columns you want to display on the screen.  You can also update the columns to view what is important for you to review, (think about security audits!)

Resource Privileges

The last section is Resource Privileges and although a similar layout to Target Privileges, remember these are the privileges on WHAT you can do in the EM12c vs. what you can access and do to targets in the EM12c environment.

em_Sec_priv4

Notice that, just as in the previous section, we can show the internal names for privileges, (very helpful if you need to run EM CLI commands, scripts or queries.) and then you can also Expand, Collapse, order with scrolling or reorder the columns to view the data in the way that makes the most sense for what you are searching for at the time.

Roles

The roles section displays EM12c users and only those with roles assigned to them.  Remember that being an administrator or Super Administrator is not the same as being granted a role, which this page clearly displays for you:

em_sec_roles_1

This section also displays Nested Role information and you can click on the link to manage roles from this page if an issue is seen.

Privilege Propagation in Aggregates

Aggregate targets have more than one member targets assigned to them, so they require a bit more special guidance to security and be a bit challenging.   As this is a new feature in EM12c Release 4, the Security console can be very important to helping the administrator understand what roles are propagating what privileges to what aggregate targets.  This can save from having a user with access to a member target that may not have been necessary.

The graph that is displayed at the bottom of the page shows roles that are at risk due to privilege propagation to aggregate targets, (member targets) and offers information to assist in addressing the possible threat:

em_sec_agg1

Summary

All in all, the Security Console is just the first step in assisting the administrator in securing the EM12c environment that now accesses so much more than just a database.  The data it provides offers great assistance to both those just starting out with Enterprise Manager as well as veterans to the product.  Remember to check out this valuable new option to help secure your environment after you go to Enterprise Manager 12.1.0.4!


Tags:  

Del.icio.us
Facebook
TweetThis
Digg
StumbleUpon


Copyright © DBA Kevlar [EM12c Rel. 4, the Security Console], All Right Reserved. 2014.

EM12c and Hardware

$
0
0

I often hear, “My EM12c environment is slow!” and I just as often am granted access to the environment and find out that EVERYTHING is running on an old single core server with 2Gb of RAM someone found lying around.  Enterprise Manager is often an after thought to many IT organizations.  After all the work has gone into the production environments that build revenue, there is often a disconnect on how important information on the health and status of those revenue machines are, resulting in Enterprise Manager receiving the “cast off” servers for their hosted environment.

So today we are just going to talk about sizing out an EM12c environment-  no tuning, yet, (but we’ll get to it!)

How does the team I work with decide what recommendations to make and why is it important to make those recommendations?

The questions to ask when designing or upgrading an EM12c environment are:

  1. How many targets will you be monitoring?
  2. Here are the features we have available outside of just the basic monitoring, etc.  What do you foresee the business finding the most value in?
  3. How many users will be accessing the Enterprise Manager console?
  4. Do you have any unique firewall or network configurations?

The basic sizing recommendations, along with recommendations to meet MAA, (Maximum Availability Architecture) are shown below, decision factors are on number of targets and users*:

em_sizing

Armed with this info, is your EM12c environment under-size or under-powered?  Next, we’ll talk about why the database is not the only thing you should be tuning in your EM12c environment and why the SCP, (Strategic Customer Program) has so much value!

*There are other factors, including features, management packs, plug-ins, etc. that can also impact the build and design of an EM12c environment for optimal performance.


Tags:  

Del.icio.us
Facebook
TweetThis
Digg
StumbleUpon


Copyright © DBA Kevlar [EM12c and Hardware], All Right Reserved. 2014.

Tuning EM12c- Onto the Next Tier, JAVA

$
0
0

I’ve already talked about the recommendations we make for properly sizing an Enterprise Manager 12c and many already know about tuning a database, but let’s look at the tuning that may be a bit foreign to DBAs.  We’ll start with Java.

We all know that it’s part of the EM12c architecture, but we often don’t realize that it requires attention to assist in Enterprise Manager running efficiently.

JAVA Updates

The Java component of the Enterprise Manager stack must be maintained- which includes applying java updates and also including the JAVA timezone information, which is so often overlooked. The JAVA TZUpdater is important for global deployments, crucial to those deployments that span multiple geographic zones.

To apply the TZUpdater, once downloaded, you run the following:

>$ORACLE_HOME/jdk/bin/java -jar tzupdater.jar

All patches, updates and any security or critical fixes must be applied to ensure you are up to date with your Java environment.

Upgrading the JDK is quite simple, as it requires you to simply replace the current $ORACLE_HOME/jdk directory with the newest download, (think like OPatch… :))  At the same time, you want to use Java versions 1.6.0- 1.6.0_43 with EM12c.  Avoid JDK 1.7, which isn’t supported.

JAVA Heap size

The JAVA heap size is set by default to 2GB, (2048 value.)  A larger heap size allows for more processing to be performed in parallel.  For smaller environments, this value might be adequate, but as your EM12c grows, it is important to check and see if the value is still satisfying and if not, increase it.  Increasing the value is referred to as vertical scaling and allows the existing OMS to handle more in with memory and capacity vs. just adding additional OMS’.

To update the vaules, you would perform this via an emctl command.  In the following example, we are updating the heap size to double the default, resulting in a value of 4GB, (4096):

>emctl set property -name JAVA_EM_MEM_ARGS
        -value "-Xms256m -Xmx4096m -XX:MaxPermSize=768M -XX:+UseConcMarkSweepGC 
              -XX:+UseParNewGC -XX:+CMSClassUnloadingEnabled
              -XX:CompileThreshold=8000 -XX:PermSize=128m"

We’ve moved almost all of our EM12c installations to 64-bit, but if you are still using a 32-bit version, know that there is a 1.7GB limit on the heap size for JAVA.  Increasing past this will not increase performance, so don’t configure it past the 1.7GB value for 32-bit installation.

Remember to modify only the ‘-Xmx’ parameter to change the heap size for JAVA.  Leave all other parameters at their default, including the defaults for the values of the ‘-Xms’ and/or ‘-XX’ parameters.

JDaaS, JVMD as a Service

OK, so this isn’t about improvements for EM12c performance, but I think this is just so cool, I had to add a “blurb” about it here.  This is new to EM12c, Release 4, (12.1.0.4.)

JDaaS is designed to enable Information Technology environments to allow their users to consume JVMD functionality in a self-service manner & manage all their JVMs within a new self-service portal

The Self Service Portal Admininistrators, (SSA) can enable JVMD on their JVMs regardless of JVMs being targets in EMCC.  To enable the cloud, all that is required is to set the Quotas, set as Roles and are in terms of number of monitored JVM servers.  Users then use this functionality by downloading an agent from the SSA and deploy in on the JVM they wish to monitor.

This is the first of many posts on tuning recommendations that are often made by the SCP team as we work with Oracle’s customers, but this should help folks to start realizing how much more power they have with EM12c-  not just to control the JAVA used by the EM12c environment, but some of the JVM in the applications, too!


Tags:  

Del.icio.us
Facebook
TweetThis
Digg
StumbleUpon


Copyright © DBA Kevlar [Tuning EM12c- Onto the Next Tier, JAVA], All Right Reserved. 2014.

Tuning EM12c, the OMS, Part II

$
0
0

We went over a few of the Java “tuning” options last time, so let’s go onto the OMS tier for this post.

Location, Location, Location

High latency issues between the OMS(Service) and the OMR, (Repository) when separated by geographical location is common.  It’s important when designing the Enterprise Manager environment that you keep your OMS hosts close to the repository hosts geo-locationally.  Your agents can be global, with minor network considerations, but the OMS and OMR should always be planned for one geo-location, (preferably one datacenter location.)

Number of Users

Sizing the OMS based on number of concurrent users might not seem like something many need to worry about-  I mean really, only the DBAs will be using it, right?

If you are looking at middleware, (weblogic) or application tier support, along with the much desired XaaS, (Everything as a Service)  this question is never out of line with requirement gathering.

So how do you tune an OMS for concurrent users?

OMS and Java Heap Size

The Java heap size can be impacting to the OMS, so again, we’ll look at this setting.  It is handled different considering you’re on an older, non 64-bit OS vs. newer, which is all 64-bit.

The default is 1.5G, but we can change this by doing the following:

>$MW_HOME/user_projects/domains/GCDomain/bin/startEMServers.sh USER_MEM_ARGS="-Xms256m"

Our resident Yoda, Werner de Gruyter advises to NOT go over 4G without checking all of the OS and OMS stats beforehand, young padawan… :)

Off to Work We Go-  Task Workers

Task Worker threads are in charge of picking up all the DBMS Scheduler jobs that are issued by EM12c to roll up metrics, collect metrics, etc.  Some of these jobs take a bit of time, more time than the standard task worker threads are allocated for vs. quantity of workers.

Due to this, we recommend checking if there is a backlog of tasks:

>repvfy verify repository -test 1001

The test will return values to show you have a backlog.  If you do, then you can run the following to collect the data that’s necessary for the system to optimize:

>repvfy dump task_health

By running this, data is collected that then can be used with the following to tune the task worker threads:

>repvfy execute optimize

Now this should address the problem, but sometimes you’ll see that it just didn’t capture the timeline that was really experiencing the problem and you STILL have a backlog.  You can force the number of task worker threads by running the following via a SQL*Plus session as the SYSMAN user:

SQL> exec gc_diag2_ext.SetWorkerCounts(<value 2-4>);

The command won’t accept anything larger than 4, so keep that in mind.

Patching

Yes, I know it’s an evil word for most, but know that we are all on this side working very hard to make it easier day in and day out.

I can honestly say that about 90% of issues that people run into are corrected in the quarterly patches.  My recommendation when experiencing an issue with the EM12c environment, no matter if it is with the OMR, OMS, Weblogic or Agents, ensure you are patched to the latest patch release.  Also, for agents, always set up patch plans to take the manual intervention out of the way.  You deserve to have this automated… :)

Now as we all love to patch, know that it’s been a topic involved in sincere and extensive discussion here in the EM Team and I foresee impressive improvements from the incredible team I work with.

There’s a lot more to cover on the OMS and then we’ll cover agent tuning, so know that Part III will be up on my Blog soon!


Tags:  

Del.icio.us
Facebook
TweetThis
Digg
StumbleUpon


Copyright © DBA Kevlar [Tuning EM12c, the OMS, Part II], All Right Reserved. 2014.

AWR Warehouse Webinar from ODTUG

$
0
0

The webinar is over, but you haven’t missed out on everything I presented on the console feature, under the hood and behind the scenes!

You can access the slides from today’s presentation, as I’ve uploaded them to slideshare and the scripts are easy to locate on the scripts page here on DBAKevlar.

Thanks to everyone who attended and a big thanks to GP for doing the introduction and ODTUG for hosting us! :)


Tags:  

Del.icio.us
Facebook
TweetThis
Digg
StumbleUpon


Copyright © DBA Kevlar [AWR Warehouse Webinar from ODTUG], All Right Reserved. 2014.

AWR Warehouse, Status

$
0
0

So the AWR Warehouse patches are out, but documentation has not officially caught up to it yet, so as we appreciate your patience.  I thought I would post about what I went over in my webinar last week when I had the wonderful opportunity to speak to the ODTUG members on this feature that everyone is so anxious to get their hands on.

Let’s start with some of the top questions:

1. Can I just load the AWR data into the OMR, (Enterprise Manager Repository) database?

A.  No, it is highly recommended that you do not do this-  use a separate database and server to house the AWR Warehouse.

2. What licensing requirements are there?

A.  The AWR Warehouse, (AWRW, my new acronym and hashtag, #AWRW) requires the Diagnostic Pack license and with this license, a limited use EE license is included for the AWR Warehouse.  This is subject to licensing changes in the future, but at this time, this is a great opportunity considering all the great features that will be included in the AWR Warehouse to house, partition, access and report on via EM12c, etc.

3.  Can I query the AWR Warehouse directly?

A.  It is another Oracle database, so yes, of course you can!

Behind the Scenes

The AWR Warehouse’s data is sourced from target databases in EM12c, providing the ability to retain AWR data indefinitely or for any period of time you choose.  For retail companies or those that do heavy once per year processing, this is gold.  The idea that you can do comparisons on performance a year ago vs. today is incredibly valuable.

This data is loaded via an ETL process using an Agent to Agent direct push of the data, initialized by an Enterprise Manager.  The actual export on the source database and import on the AWR Warehouse is performed by a DBMS_Scheduler job local to those servers.

awrw_etl

The actual interval on the source database and AWR Warehouse depends on if you’ve just added the database to the AWR Warehouse, (back load of data, requires “catch up”) or if the AWRW ETL load has been disabled for a period of time.  There is a built in “throttle” to ensure that no more than 500 snapshots are loaded at any given time and intervals that cause very little to no network traffic in the environment.  During the catchup that required a full 500 snapshots to load on a VM test environment, I was thrilled to see it took a total maximum execution time of less than 12 minutes and 2GB of data.  The network latency was nominal, too.

For the next sections, you will notice the naming convention in jobs and objects of “CAW” either in the beginning or middle of the name.  CAW stands for Consolidated AWR Warehouse and you can use %CAW% to help filter to locate via queries in any AWRW related search, including on source databases, (targets).

Source ETL Job

The job on the source database, (targets) to datapump the AWR data from the source for a given snapshot(s) to reside on an OS directory location to be “pushed” by the agent to agent onto an AWR Warehouse OS directory location.

DBMS Scheduler Job Name: MGMT_CAW_EXTRACT

Exec Call: begin dbsnmp.mgmt_caw_extract.run_extract; end;

How Often: 3 Hour Intervals if “playing catch up”, otherwise, 24 hr interval.

AWR Warehouse Job

This is the job that loads the data from source targets, (databases) to the AWR Warehouse.

DBMS Scheduler Job Name: MGMT_CAW_LOAD

Exec Call: begin dbsnmp.mgmt_caw_load.run_master;

How Often: 5 Minute Intervals

Biggest Resource Demand from the “run_master”:

begin dbms_swrf_internal.move_to_awr(schname => :1); end;

EM Job Service

The EM12c comes into play with the ETL job process by performing a direct agent to agent push to the AWR Warehouse via a job submitted to the EM Job Service.  You can view the job in the Job Activity in the EM12c console:

em_etl_job

Under the Hood

The additions to the source database, (target) and the AWR Warehouse once adding to the AWR Warehouse or creating an AWR Warehouse is done through the DBNSMP schema.  The objects currently begin with the CAW_, (Consolidated AWR Warehouse) naming convention, so they are easy to locate in the DBSNMP schema.

AWR Warehouse Objects

The additions to the DBSNMP schema are used to support the ETL jobs and ease mapping from the Enterprise Manager to the AWR Warehouse for AWR and ASH reporting.  The AWR schema objects that already exist in the standard Oracle database are updated to be partitioned on ETL loads by DBID, Snapshot ID or a combination of both, depending on what the AWR Warehouse developers found important to assist in performance.

There are a number of objects that are added to the DBSNMP schema to support the AWRW.  Note the object types and counts below:

caw_object_count

The table that is of particular interest to those of you with AWR queries that are interested in updating them to be AWRW compliant, is the CAW_DBID_MAPPING table:

dbsnmp_caw_dbid_mapping

You will be primarily joining the AWR objects DBID column to the CAW_DBID_MAPPING.NEW_DBID/OLD_DBID to update those AWR scripts.

An example of changes required, would be like the following:

from   dba_hist_sys_time_modelstm,   dba_hist_snapshot s, gv$parameter p,   dbsnmp.caw_dbid_mapping m
             where stm.stat_name in (‘DB CPU’,’backgroundcpu time’)    
             and   LOWER(m.target_name)= ‘&dbname
             and   s.dbid= m.new_dbid     and   s.snap_id = stm.snap_id
            and   s.dbid = stm.dbid           and   s.instance_number = stm.instance_number
            and   p.name = ‘cpu_count’   and   p.inst_id = s.instance_number)

 Notice that the simple change with the addition of the mapping table and addition to the where clause has resolved the requirements to query just the data for the database in question by DBID.

I’ve included some updated scripts to use as examples and hopefully give everyone a quick idea on how to work forward with the AWR Warehouse if you so decide to jump headfirst into querying it directly.

Source Database Objects

There are only a couple additions to the Source Databases when they become part of the AWR Warehouse.

source_target_count

The objects are only used to manage the AWR extract jobs and track information about the tasks.

CAW_EXTRACT_PROPERTIES : Information on ETL job, dump location and intervals.

CAW_EXTRACT_METADATA : All data about extracts- times, failures, details.

So….

Do you feel educated?  Do you feel overwhelmed?  I hope this was helpful to go over some of the processes, objects and information for AWR queries regarding the AWR Warehouse and I’ll continue to blog about this topic as much as I can!   This feature is brand new and as impressed and excited as I am about it now, I can’t wait for all there is to come!


Tags:  

Del.icio.us
Facebook
TweetThis
Digg
StumbleUpon


Copyright © DBA Kevlar [AWR Warehouse, Status], All Right Reserved. 2014.

Using ASH Analytics to View Blocked Sessions

$
0
0

When concurrency is the crippling factor in a database performance issue, often I’m told that viewing blocked sessions in Enterprise Manager is difficult.  The query behind, along with flash image generation in any Enterprise Manager can take considerable time to render and no matter how valuable the view is, the wait is something DBAs just can’t hold out for when needing the answer now.

Blocking Sessions View in OEM

If you’re wondering which feature I’m speaking of, once you log into any database, click on Performance, Blocking Sessions.

blocked_sessions

If there aren’t any or any significant load on the database, it can return quite quickly.  If there is significant load and blocking sessions, well, you could be waiting quite some time….

Behind the Scenes

The query that is run behind the scenes will be executed by the DBNSMP, (or whatever user you have configured for use from a target to communicate with the OEM) to the database in question and will look like the following:

selectsid,username,serial#,process,nvl(sql_id,0),sql_address,blocking_session,
wait_class,event,p1,p2,p3,seconds_in_wait
 fromv$session
 whereblocking_session_status='VALID' OR sid IN
 (selectblocking_session
 fromv$session
 whereblocking_session_status='VALID')

So what do you do when you need blocking information quickly and can’t wait for the Enterprise Manager Blocking Sessions screen?  Use ASH Analytics to view blocking session information!

ASH Analytics View Options

Start out by telling me you have installed ASH Analytics in your databases, right?  If not, please do this, it’s well worth the short time to install the support package and view via an EM Job for this valuable feature.

Next, once its installed or if you’ve already installed it, then for any database target Home Page in the EM12c, click on Performance, ASH Analytics.

ash_Access

The default timeline will come up for ASH Analytics.  If the blocking is occurring now, no change to the time window will be required and you’ll simply scroll down to the middle wait events graph.

ash_analytics1

Notice that no filters or session data is present on the current graph and it’s focused on the standard Wait Class data.  This can be updated to view blocking sessions and offer very clear info on the sessions and waits involved by doing the following quick changes:

Switch to

  • Load Map from Top Activity
  • Switched to Advanced Mode
  • Chose the following Dimensions of data to display
             – Blocking Session
             – User Session

You will see the following data displayed instantly on the screen, without the wait.

blocked_sessions3

You will see the blocking sessions and below, will be displayed the sessions blocked for each.  If there is more than one session blocked, it will show as a second, third, fourth box, etc. under the blocking session ID.

Advanced Dimensions for Blocking Sessions

If you want to build out and see what wait events are involved on the blocking session, this can be done as well.  Just move the Dimensions bar below the load map from two dimensions to three.  Then add another dimension to the load map.

ash_analytics_3

I now can see that I have a concurrency issue on one of the blocking sessions, (calling same objects) and the second blocking session is waiting on a commit.

The additional advantage of using this method to view blocking session data is that it’s not just “current blocking data” that is available as when you use the “Blocking Sessions” view in OEM.

bar1

Using ASH Analytics allows you the added option to move the upper bar to display time in the past or move it to view newer data just refreshed.

If there is specific data that you are searching for, (username, SQL_ID, etc.)  change the dimensions to display what you are interested in isolating.  ASH Analytics supports a wide variety of data to answer questions about blocking sessions along with all other types of ASH data collected!


Tags:  

Del.icio.us
Facebook
TweetThis
Digg
StumbleUpon


Copyright © DBA Kevlar [Using ASH Analytics to View Blocked Sessions], All Right Reserved. 2014.

Renaming an Oracle Apache Target in EM12c

$
0
0

When installing Enterprise Manager 12c, the host value can come from a number of places for different applications/tiers.  For most, it comes from the environment variable $ORACLE_HOSTNAME, (for Windows Servers, %ORACLE_HOSTNAME%).

The OHS1 target, aka Oracle Apache in the middle tier of the EM12c environment pulls it’s value from the etc/hosts file, (for Unix as well as Windows) and so it is vulnerable with a virtual host name or host name change occurs.  It can, however, be updated post installation when the OHS1 target fails to return an active status in the EM12c console.

Update the Configuration File

The file that control the configuration of the OHS1 target is the topology.xml file that is located in the $OMS_HOME\user_projects\domains\GCDomain\opmn\topology.xml

Edit the topology.xml file and replace/add the following entries in bolded text, replacing Virtual_Cluster_name with the name of the Cluster:

- <ias-instance id=”instance1″ oracle-home=”G:\app\aime\product\em12c\Oracle_WT” instance-home=”G:\app\aime\product\gc_inst\WebTierIH1″ host=”<New Host Name>” port=”6701″>
- <ias-component id=”ohs1″ type=”OHS” mbean-class-name=”oracle.ohs.OHSGlobalConfig” mbean-interface-name=”oracle.ohs.OHSGlobalConfigMXBean” port=”9999″ host=”<New Host Name>“>

 Save the file with the new changes.

Remove the OHS1 Target

Log into your EM12c console as the SYSMAN user, (or another user with appropriate privileges) and click on All Targets.  Either do a search for the OHS1 target or just scan down and double-click on it.  The target will show as down and display the incorrect associated targets with the HTTP Server:

ohs_tgt_wrong

You will need to remove and re-add the target to have the EM12c utilize the topology.xml file configuration update to the new host name.

To do this, click on Oracle HTTP Server–> Target Setup –> Remove Target. The target for the Oracle Apache server/HTTP Server, along with its dependents have now been removed.

Refresh the Weblogic Domain

To re-add the OHS1 target, we are going to use a job already built into EM12c.  Go back to All Targets the Targets drop down.  At the very top you will commonly see the EMGC_GCDomain, (Grid Control Domain, yes, it’s still referred to it as that… :))  Log into this target.  There are two “levels” to this target, the parent and then the farm.  Either one will offer you a job in the drop down to Refresh Weblogic Domain.

weblogic_refresh

Once you click on this job, it will ask you to remove or add targets.  You can simply choose to Add Targets and the job will first search for any missing targets that need to be re-added.  Commonly it will locate 12 and display a list of the targets it wishes to add.  You will note that the OHS1 target now displays the CORRECT host name.

Close the window and choose to complete through the wizard steps to add these targets to the Weblogic domain.

Return to All Targets and access the OHS1 Target to verify that it now displays an active status-  it may take up to one collection to update the target status.


Tags:  

Del.icio.us
Facebook
TweetThis
Digg
StumbleUpon


Copyright © DBA Kevlar [Renaming an Oracle Apache Target in EM12c], All Right Reserved. 2014.

Metric Thresholds and the Power to Adapt

$
0
0

Metric thresholds have come a long way since I started working with OEM 10g.  I remember how frustrating it could be if an ETL load impacted the metric values that had to be set for a given IO or CPU load for a database when during business hours, a much lower value would be preferable.  Having to explain to the business why a notification wasn’t sent during the day due to the threshold set for resource usage for night time batch processing often went unaccepted.

With EM12c, release 4, we now have Time-based Static thresholds and Adaptive thresholds.  Both are incredibly valuable to ensuring the administrator is aware of issues before they become a problem and not let environments with askew workloads leave them unaware.

Both of these new features are available once you are logged into a target, then from the left side menu, <Target Type Drop Down Below Target Name>, Monitoring, Metric and Collection Settings.  Under the Metrics tab you will find a drop down that can be changed from the default of Metrics with Thresholds to Time-based Static and Adaptive Thresholds which will allow you to view any current setup for either of these advanced threshold management.

adv_thresh_page2

To access the configuration, look below on the page for the Advanced Threshold Management link-

adv_thresh_page3

Time-Based Static Thresholds

The concept behind Time-based Static thresholds is that you have very specific workloads in a 24hr period and you wish to set thresholds based on the resource cycle.  This will require the administrator to be very familiar with the workload to set this correctly.  I understand this model very well, as most places I’ve been the DBA for, I was known for memorizing EXACTLY the standard flow of resource usage for any given database.

In the Time-based Static Threshold tab from the Metrics tab, we can configure, per target, (host, database, cluster) the thresholds by value and time that makes sense for the target by clicking on Register Metrics.

This will take you to a Metric Selector page that will help you set up the time-based static thresholds for the target and remember, this is target specific.  You can choose to set up as many metrics for a specific target or just one or two.  The search option allows for easy access to the metrics.

adaptive12

Choose which metrics you wish to set the time-based static thresholds for and click OK.

You can then set the values for each metric that was chosen for weekday or weekend, etc.

adaptive13

You will be warned that your metric thresholds will not be set until you hit the Save button.  Note: You won’t be able to click on it until you close this warning, as the Save button is BEHIND the pop-up warning.

If the default threshold changes for weekday day/night and weekend day/night are not adequate to satisfy the demands of the system workload, you can edit and change these to be more definitive-

adv_thrhld5

Once you’ve chosen the frequency change, you can then set up the threshold values for the more comprehensive plan and save the changes.  That’s all there is to it, but I do recommend tweaking as necessary if any “white noise” pages result from the static settings.

Removing Time-based Static Thresholds

To remove a time-based threshold for any metric(s), click on the select for each metric with thresholds that you wish to remove and click the Remove button.  You will be asked to confirm and the metric(s) time-based static threshold settings will be reverted to the default values or to values set in a default monitoring template for the target type.

Adaptive Thresholds

Unlike the Time-based Static Thresholds, which are based off of settings configured manually, Adaptive Thresholds source their threshold settings off of a “collected” baseline.  This is more advanced than static set thresholds as it takes the history of the workload collected in a baseline into consideration when calculating the thresholds.  The most important thing to remember is to ensure to use a baseline that includes a clear example of a standard workload of the system in the snapshot.

There are two types of baselines, static and moving.  A static baseline is for a given snapshot of time and does not change.  A moving baseline is recollected on a regular interval and can be for anywhere from 7-31 days.

The reason to use a moving baseline over a static one is that a moving baseline will incorporate changes to the workload over time, resulting in a system that has metric growth to go with system growth.  The drawback?  If there is a problem that happens on a regular interval, you may not catch it, where the static baseline could be verified and not be impacted by this type of change.

After a baseline of performance metric data has been collected from a target, you can then access the Adaptive Thresholds configuration tab via the Advanced Threshold Management page.

You have the option from the Advanced Threshold Management page to set up the default settings for the baseline type, threshold change frequency and how long the accumulation of baseline data should be used to base the adaptive threshold value on.

adaptive11

Once you choose the adaptive settings you would like to make active, click on the Save button to keep the configuration.

Now let’s add the metrics we want to configure adaptive thresholds for by clicking on Register Metrics-

adaptive14

You will be taken to a similar window that you saw for the Time-based Static Thresholds.  Drill down in the list and choose the metrics that could benefit from an adaptive threshold setting and once you are done choosing all the metrics that you want from the list, click on OK.

Note:  Once you hit OK, there is no other settings that have to be configured.  Cloud Control will then complete the configuration, so ensure you have the correct you wish to have registered for the target.

adaptive15

Advanced Reporting on Adaptive Thresholds

For any adaptive threshold that you have register, you can click on the Select, (on the right side of the Metric list) and view analysis of the threshold data to see how the adaptive thresholds are supporting the metric.

adaptvie16

You can also test out different values and preview how they will support the metric and decide if you want to move away from an adaptive threshold and to a static one.

You can also choose click on the Test All which will look at previous data and see how the adaptive thresholds will support in theory in the future by how data in the baseline has been analyzed for the frequency window.

For my metric, I didn’t have time behind my baseline to give much in the way of a response, but the screenshot gives you an idea of what you will be looking at-

adaptive18

Removing Adaptive Thresholds

If there is a metric that you wish to no longer have a metric threshold on, simply put a check mark in the metric’s Select box and then click on Deregister-

adaptive17

You will be asked if you want to continue, click Yes and the adaptive threshold will be removed from the target for the metric(s) checked.

Advanced threshold management offers the administrator a few more ways to gain definitive control over monitoring of targets via EM12c.  I haven’t found an environment yet that didn’t have at least one database or host that could benefit from these valuable features.


Tags:  

Del.icio.us
Facebook
TweetThis
Digg
StumbleUpon


Copyright © DBA Kevlar [Metric Thresholds and the Power to Adapt], All Right Reserved. 2014.

EM12c Release 4, Health Overview

$
0
0

As part of the projects I work on at Oracle, it’s often ensuring that those customers that wish to deploy Enterprise Manager, (EM12c) to large environments, have the correct settings and are tuned to offer the best performance from the Oracle Management repository database, weblogic and up to the console URL’s accessed by users.  This means that these large environments often receive recommendations from our experts  that differ from what EM12c comes “out of the box” with.

For those that aren’t receiving internal Oracle training on what to look for and how to tune EM12c tiers, there are some new features in release 4 that should be checked out by anyone using EM12c.

EM12c Health Overview

The Health Overview is accessible via the Setup menu, (right side of Console), Manage Cloud Control and Health Overview.

ho1

We’ll go over each of these new monitoring tools, but the Health Overview includes valuable information about the health of both the Oracle Management Repository, (OMR) and the Oracle Management Service, (OMS).

The overview page breaks down into easy to understand sections.  The first is basic information and workload on the OMS:

ho2

From here you can see all pertinent, high level information about the OMS/OMR, including OMS information, the number of agents, including status counts on availability and if a load balancer is used in the EM12c configuration.  Important target status availability is posted, along with how many administrators have been given access to the EM console.

Below this we can view the backlog graph on the right hand side of the page:

ho2

That right hand graph is important since along with the upload rate, you can see if there is a consistent backlog of XML files to be uploaded and that can signal performance trouble.  A backlog can cause problems, as this beings there is a backlog for the loader can delay receipt of critical alerts and information about a target.  If the backlog becomes too extensive, an agent can reach a threshold on how many files it can handle backlogged and stop collecting, which is a significant issue.  It’s important that if serious backlog issues are noted, tuning options to deter from them, (like add a load balancer to assist in managing the workload or a second OMS.)

Repository Details

The next section includes connection information, which also has the service name, the database name and database type, the port and job system status.  On the right is a graph showing if any backoff requests have been sent.  These occur when the OMS is busy processing an XML upload and requests the agent to hold off on sending anymore files until it has finished.

ho3

Notification Information

Scanning down from the backoff graph in the Health Overview displays the Notification backlog graph.  Knowing how backlogged your time-sensitive notifications are performing is crucial when someone asks if there is anyway to know why one of the notifications weren’t received in a timely manner and you can quickly assess if it is an issue with EM12c or if the problem resides elsewhere.

ho4

Alerts

The last section in the health overview covers incident management.  You can easily see if there are any Metric Collection Errors, (corresponding this to the backlog data above if necessary), access related Metric Errors and Related Alerts.

ho5

You also can choose to launch the Incident Manager from the Health Overview console if you wish to get more details about all incidents currently in the queue. This view is really to give you a very high level account of what incidents are currently open and related alerts and metric errors.  Use that button to launch the Incident Manager if you wish to see what the alerts are all about.

We’ll dig into the deeper diagnostic data offered in EM12c, release 4 for the OMR, OMS and Agents in subsequent posts, so until next time!


Tags:  

Del.icio.us
Facebook
TweetThis
Digg
StumbleUpon


Copyright © DBA Kevlar [EM12c Release 4, Health Overview], All Right Reserved. 2014.

Oracle Enterprise Manager 12c Command Line Interface is Available!

$
0
0

The new Oracle Enterprise Manager 12c Command Line Interface book is available via a number of locations, including Amazon and directly from Apress.  If you are an EM12c fanatic or just learning and want to learn more, consider the new book that will show you why the command line returns the DBA to the golden age, empowering Enterprise Manager to script and enable tasks at a global level!

9781484202395HiRes


Tags:  

Del.icio.us
Facebook
TweetThis
Digg
StumbleUpon


Copyright © DBA Kevlar [Oracle Enterprise Manager 12c Command Line Interface is Available!], All Right Reserved. 2014.

EM12c, Rel. 4, OMS and OMR Health, Part II

$
0
0

There are a large number of “moving parts” when performance tuning or trouble shooting an Enterprise Manager environment.  The new EM performance features, (available in release 12.1.0.4) are there to assist you in understanding the source of the issue and can really make the difference for those that are unfamiliar with the challenges of Weblogic, java, network or other complexities that make up EM12c and aren’t commonly thought of as part of the DBA’s job role.

Now that we’ve finished with the Health Overview, we can look deeper into the health and performance of the two most well known components of the EM12c architecture, the Oracle Management Repository, (OMR) and the Oracle Management Services, (OMS).

Due to the impressive features offered in the new EM performance consoles, I’m going to break these up into multiple posts and start with OMR and focus on the Repository Tab.

The Repository

The Repository Tab is accessed via the same Setup menu in EM12c console:

rep1

Once accessed, there are a number of tabs at the top of the page, Repository, Metrics and Schema.  Starting with the Repository tab, (Left to Right) we’ll inspect what specific performance data is important when reviewing an OMR.

Repository Tab

The Repository page is going to display a number of graphs that tells you everything from specific information about the OMR database, incidents involving the OMR database and even how collections performance at the database repository level.  It is important to remember that this tab is all about the Repository, (OMR) and should not be confused with the Service, (OMS).

Basic Information

We begin by viewing information about database name, space allocated, space used number of current sessions actively connected to the OMR.

rep5

All of these are links, so you can click on the link and a you’ll be taken to a detailed view of the data and more information to investigate if you have questions.

For the Target type for the OMR, you can click on the target name, (db name) and the console will take you to the home page for the OMR database.

Click on Last Backup date and the console will take you to the backup activity report for the OMR database.

Click on Space Used and the console will then bring you to the Management Services and Repository page drill down for Repository Tablespace Used.

rep6

There is a ton of information in this location and we’ll dig deeper into it as a separate post, but just to understand how user friendly the interface is, note the links you have at your fingertips right here.

If you click on Management Service Repository Sessions, the following table with session type and counts will display:

rep7

Incidents

On the right hand side of the top of the page, we access to the incidents linked to the OMR.  No other incidents will be listed except the ones connected to the OMR, so this is a great place to check first when you are experiencing issues.

rep8

Notice that it includes incidents for page processing time outs to the OMS and collection timeouts.  This can be very helpful when you are experiencing slow response and need to know where the issue is sourced from.

Initialization Parameters for the OMR

Not only does the next graph identify what size category you fall into for your Enterprise Manager environment, (small, medium or large) but it also lets you know if any of your parameters are outside of the recommended sizing for that category.

rep9

In our example, you can see that we don’t have a set MEMORY_TARGET value and that is outside of our compliance as we recommend to have this set to one.  We can also view each of the values we do have set and how they compare to what Oracle thinks the minimum value for that category of OMR size should be.

Job Scheduler Status

To the right of the Init parameters is all the graph with information pertaining to all the jobs running in the OMR to support the Enterprise Manager environment.  Unlike Job Activity in the console, this is reporting all those jobs that are taking care of the Enterprise Manager.

If a job fails and you have the option to edit the schedule to run again, (the glasses icon) then you can click on the glasses and the following popup will show and you can then enter a new time for the job to retry:

rep11

Once you enter in the new time to run the job, click on Save and verify that the job has been successful in the console view, (green check mark vs. a red X.)

Collections Performance

At the bottom left, Collections is the next category that’s covered.  If collections aren’t uploading to the OMR, then the console isn’t able to provide the most up to date data and notifications of incidents and alerts aren’t sent out to notify administrators of issues.  Timely collections and the performance of collections is of a great concern to an EM Cloud Control administrator.

rep12

The graph is well laid out and shows clearly the number of collections in backlog and throughput performance.   The top of the graph, when hovered over, will show you the warning and critical threshold line for number of backlogs allowed.

Backlog is an issue, as if it gets too high and hits the threshold, your agent can stop uploading.  You can also see the duration, on average of the collections and view over time if the duration is increasing.  If you use a lot of metric extensions or plug-ins, this is something you’ll want to monitor, so this graph is extremely helpful when inspecting collection performance.

By hovering your cursor over the Collections Backlog line in the graph, I then am offered a number of options to look into the performance:

rep13

You have the option to click on Problem Analysis to look into the backlog, Metrics Detail or go to the Target Home.

Problem Analysis

As my EM environment is running quite smoothing at the OMR level, there isn’t a lot to show you in the Problem Analysis, but I wanted to at least give everyone a peak into this cool, new tool.

rep14

First of all, if I did have an issue, there would be collections showing in backlog.  This is very important for an administrator to check and ensure that backlog is not occurring.

As there is no backlog, you can see, my resource usage by my collections is pretty consistent and quite below the thresholds expected for most of the resource types shown:

rep15

You can also export the data from the table view, (small link at the bottom right of the screen, not shown) if you need the raw data.

You will note that my memory utilization is creeping, little by little to the critical threshold.  This is commonly due to java garbage collection causing a small memory leak and should be reviewed from time to time.  If it is considerable, the java heap should be examined and a more efficient value set.

Adding Metrics to the Performance Analysis

On the right hand side of the Performance Analysis, you will notice the Metric Palette.  This offers you the opportunity to go from the standard configuration to display more data on the existing metrics or add analysis on other metrics, such as Agents and Page Performance.

It’s important to know, even though you can be brought to this page from many different links within the OMR/OMS Performance pages, while you are in the Performance Analysis, you can inspect other performance metric factors than just the original ones you are reviewing.

For our example, we’ll add an additional metric graph,(Time estimates for clearing backlog) for review to the left hand analysis page-

rep16

We now have an additional graph on the left hand side analysis to compare to our existing data to see if the load times correlate to resource usage:

rep17

This can be done for dozens of metrics and offers some incredible analysis power when researching performance issues with EM12c.  The Performance Analysis link is one of the most powerful tools for locating where a bottleneck in performance is coming from and very quickly.  The fluid ability to add metrics to the graphs section and see how they correspond to the other resource usage is incredibly beneficial as well.

Metric Details

Now back to our Collections graph, if you remember we had three options when we click on the blue line:

rep13

By clicking on the Metrics Details link, we’ll then go to performance page for All Metrics.

rep18

This page displays information about the number of short and long running collections in backlog and will display the status if the threshold value has been hit for backlog quantity.  The page functions similar to Incidents, in that you can click on the right middle button to display the Task Class information highlighted to full page.

You are also offered the option to modify thresholds if the current values don’t meet the demands of the system is under currently, but know that the recommended values are their for a reason and the option to change them should be seriously researched beforehand.

Target Home

This link takes you to the Overview and Health page for the OMR.  I get to save a lot of typing by just sending you to my blog post on this great feature! :)

A final clarification, too-  the three options available, Performance Analysis, Metric Details and Target Home are options available for each metric by double-clicking in the Repository Collections Performance or the Metric Data Rollup graph, which we’ll discuss next.

Metric Data Rollup Performance

The last graph, in the right hand bottom corner, is the for metric data.  This graph displays the number of metric records rolled up and the throughput per minute for this data to be uploaded into the OMR.

We again have the ability to inspect performance analysis by double-clicking on the metric in the graph.

rep19

Each of the three options work almost exactly the same way as I demonstrated for the Collections Performance, but the data is based on the metrics rollup.

The main functionality of each of these sections is to realize how many different ways you can do performance analysis on different performance data:

rep20

Yes, even the legend can be clicked on and a detail option chosen.

That completes the review of the Repository Tab, remember, I have two more tabs to cover in posts before we dig into the Management Services and Agents performance consoles.

rep21


Tags:  

Del.icio.us
Facebook
TweetThis
Digg
StumbleUpon


Copyright © DBA Kevlar [EM12c, Rel. 4, OMS and OMR Health, Part II], All Right Reserved. 2014.

Removing Redundant Startup/Restart for the OMS Service in Windows

$
0
0

I’ve been told many times that the OMS for EM12c can take quite some time to start on Windows.  Some told me it took anywhere from three to up to fifteen minutes and wanted to know why.  I’ve done some research on the challenge and it is a complex one.

Let’s start this post by stating that even though I’m focusing on the OMS service that is part of the Windows installation of EM12c from Oracle, that in no way is it to blame, nor is it the only application to have this problem, (so this post may help many others) and it has more to do with over-engineering on MANY different non-Oracle levels and in no way is it a bug.  At the same time, it can really impact the quality of user experience with EM12c on Windows and it helps if you know WHAT is causing the challenge vs. what will easily have fingers pointed to as the blame. We all know that Oracle is blamed until proven innocent, so it’s important that we understand what is happening to correct the problem vs. just pointing fingers.

As most DBAs aren’t as familiar with the Windows OS Platform, lets quickly review what a Windows service is and why its important-

A Microsoft Windows services, formerly known as NT services, creates long-running executable applications that run in their own Windows sessions. These services can be automatically started when the computer boots, can be paused and restarted, and do not [require a] user interface.

When installing Enterprise Manager 12c on Windows or installing even the Oracle database on the Microsoft Windows OS platform, a service is created to support the application.  This service can be created a number of ways, but for Oracle, they support the following:

oradim - new -[sid] -intpwd [password] -maxusers [number] -startmode [auto|manual] -spfile [directory location of spfile]
emctl create service [-oms_svc_name <oms_service_name> -user <username> -passwd <password>]

and then we have Windows method of a service command:

sc create [service name] -binPath= "[path to executable to start app and argument]" start= [auto|manual] displayName= [name to display]

Each of these options are supported to create many of the different services that are needed to support different features/targets in Enterprise Manager and are used as part of the installation process via the Database Configuration Assistant, the Network Configuration Assistant and the Oracle Installer.

One of the enhancements that they are working on for EM12c is moving the java thread startup and stop from serial to multi-threaded processing.  This is going to speed up the start and stop of the OMS extensively, (anyone tracing the startup of an OMS to see where time is being spent will undoubtedly see that over 80% is the weblogic tier….)

Until this enhancement is made, the extended time trips a few safety measures that are built at a number of levels into services to ensure they stay up.  If a service isn’t up, well, you aren’t going to be using the application, so unfortunately for us, this is where the OCD of the development world has come back to haunt us…. :)

Tracing and Advanced Logging

First, we need to get more info from our node manager to see what is starting the service and when it’s timing out and what is restarting it.  We can do this by going to the following:

$GCINST_HOME\NodeManager\emnodemanager

Make a backup copy and then choose to edit the original nodemanager.properties file

By default, the loglevel=info

There are numerous log level settings:

  • SEVERE (highest value)
  • WARNING
  • INFO
  • CONFIG
  • FINE
  • FINER
  • FINEST (lowest value)

My recommendation is to set it to FINEST if you really want to log whats going on, but don’t leave it there, as it will produce a lot of logging and unless you are trouble-shooting something, there just isn’t any need for this amount of fine detail, so remember, a restart of the OMS service is required to update any change to the logging.

Update the loglevel info, save the file and restart the service.  The data will be saved to the following file:

$GCINST_HOME\NodeManager\emnodemanager\nodemanager.log

To understand more about tracing and logging, see the Oracle Documentation that can take you through it, (as well as save me a lot of typing… :))

Trace and Log Files

em.start                    Tells you if there were any time outs and at what step the timeout occurred.

OracleManagementServer_EMGC_OMS1_1srvc.log  This is the logged startup and shutdown of the actual service.

nodemanager.log     This is the log of the nodemanager’s interaction with the OMS service.

EMGC_OMS1.out    Steps of weblogic startup, java threads and times.

emctl.log                  Also shows timeouts set by emctl start process.

emoms_startup.trc  Shows timeout by connections, (including sqlnet timeouts)

emoms_pbs.trc      Shows actual timeouts at java level

There’s more data out there than this, especially if you use the EM Diagnostics kit, but just to start, it’s a good beginning.

Services

The OMS Service in Windows uses a standard naming convention, so it should look very similar to the one below:

oms_services


Even though we are seeing one service, it can be controlled by many different daemons to ensure it is always running, as well as managing how long it has before timing out when it starts and restart options.

1. Service Timeouts:

There are two in the registry, depending on the version of Windows server that you have.  These are here to assist you, but due to redundancy, they could impact you as well. These two values control how long to wait for a service to start before timing out and how long to before killing a service or if unresponsive to kill.

To see these, you will be working in the registry.  The registry is the nervous system of the OS, so take great care when working with it and always make a backup of the folder you are working in before making any changes.

Click on Start –> Run Enter “Regedit” and click OK Go to Computer\HKEY_LOCAL_MACHINE\SYSTEM\CurrentControlSet\Control

Right click on the Control folder, choose export and save off the registry file as Services_TO.reg
In right hand “details” view and remove the following values, (either or both may be present) or even better, set them to a time that will allow enough time for the OMS to start before these come in and try to restart:
ServicesPipeTimeout
WaittoKillServicesTimeout

Remember, any changes you make here do not take effect until after you restart the computer.  You can revert any changes by importing the saved registry file backup you made beforehand and performing another restart.

2. Auto restart of the OMS by the Node Manager

The node manager’s job is to ensure that the Windows Service is up and running for OMS. It is there check the OMS service and if it sees its down, restart it.  If this is attempting to restart the OMS service while the registry setting are attempting to restart the OMS service, well, you are going to start seeing the issue here.

To stop Nodemanager from attempting to auto-restart service upon timeout:

Go to $GCINST_HOME/user_projects/domains/GCDomain/servers/EMGC_OMS1/data/nodemanager/startup.properties

Create backup of the startup.properties file and then open the file in an editor such as notepad or wordpad:
go to the following line: AutoRestart=true
Change value to “false
Save the changes and the node manager will no longer attempt to autorestart the service if it sees it down once restarted.

3.  Clustered services added to a failover, Oracle Failsafe or other clustering process, (not RAC).

Clustering, at an OS level is primarily for high availability, so redundant checks and restart options are built in everywhere for Windows services added.  In the example of a failover cluster, the OMS service is added to the failover node.

fo_cluster_main

This allows for it to automatically fail over with the shared Virtual server and shared storage to the passive node and start up if there is a failure.  The clu2 Virtual server has policy settings telling the OS what to do in case of failure and how to restart.  This, by default is applied to all dependent resources and shared storage allocated to it.

fo_cluster_prop

As you can see in the clu2 properties, the policies have been set if:

  • A failure occurs, restart services and storage on the original active node.
  • If the restart fails, then failover to the passive node.
  • If the service or resource doesn’t start within 15 minutes, timeout.

You’ll also notice there is an option to not restart, as well as how soon a restart should be attempted.

You can update this at the server level properties, which will automatically propagate to the dependent resources, (it is the master of all policy settings, so you should set them here.)

fo_cluster_prop_2

We have now asked in case of failure, do not restart and don’t timeout for 30 minutes.

Summary

I’ve shown you all the redundant settings that have been built in to ensure that the service is restarted and how long it can attempt to start before timing out and if it should restart and how long between restarts.  The key to all this is knowing that only ONE should be managing this.  If you decide to let Oracle manage it, then use the Node Manager settings and disable option 1 and 3.  If you decide to let Microsoft handle it at the Service level, then disable 2 and 3 and so on.

Understand that if they are all left to manage on top of each other, you will have one timing out the start up while the another is still attempting to start and another notes it’s down and issues a restart.  If you wonder why it’s taking 15 minutes or more to start your OMS on Windows, I’ll bet money you trace out the session and you’ll find more than one process attempting to start or restart the poor thing in your logs.

Honesty dictates that we shouldn’t just blame a complex issue on any one contributor and realize that with added complexity comes the need for added skills to ensure that you have the best configuration to support the technology.  Taking the time to trace out and understand the issue will help make that happen.


Tags:  

Del.icio.us
Facebook
TweetThis
Digg
StumbleUpon


Copyright © DBA Kevlar [Removing Redundant Startup/Restart for the OMS Service in Windows], All Right Reserved. 2014.

Retrieving Bind Values from SQL Monitor in EM12c Release 4

$
0
0

I know others may want to know how to do this and I had challenges until Gagan Chawla, a teammate from Oracle, was kind enough to point out how to still get to this hidden, little gold nugget, so I’m posting it here for others!

Up till database plug-in 12.1.0.5, while in SQL Monitor SQL ID details page, you could click on a button called View Report and quickly view a large amount of valuable data about a SQL statement that had executed.  One of the sections in this report was binds, which listed what values were being passed for the bind variables.

binds1

If you are investigating a performance issue for the execution of a SQL statement, having bind values can give you a significant advantage.  It can tell you:

  1. Is the value outside the min/max value on an existing histogram.
  2. Do statistics lean towards another value being more prevalent.
  3. Is the value passed in not in the correct format.
  4. Does the value searched impact due it’s different from the values known and/or counts expected are off.

There are a number of other reasons, but to have this data and to have it easily accessible at your fingertips is very beneficial to the person trouble shooting.

Post the database plug-in, the feature is no longer where it once was.  From the SQL Monitoring, Monitored SQL Executions, if you were to a SQL ID of interest, you would then go to the SQL Details page.

binds2

There is a new report called “SQL Details Active Report“, but it doesn’t contain the bind values data.  This report is still very, very valuable:

binds3

It shows all the above data, along with a wait event vs. all resource usage graph at the bottom of the report.  You can save or mail the report and all it’s relevant data.  It would still be nice to have the previous report with the bind values that was once available from the details page and you can get to it, but you just need to make a few more clicks.

Go back to the main Monitored SQL Executions page and locate the SQL that you are interested in:

binds4

Bring your cursor to the status column for that SQL ID and double click.  This will take you the the Monitored SQL Executions, SQL Detail Page and on the right hand side, you will see the View Report button.

binds5

This button will bring you to the previous SQL ID Details report that includes the bind data.  Another thing to remember is that you must also be viewing a database that supports the feature, which means Oracle 11.2 or higher.


Tags:  

Del.icio.us
Facebook
TweetThis
Digg
StumbleUpon


Copyright © DBA Kevlar [Retrieving Bind Values from SQL Monitor in EM12c Release 4], All Right Reserved. 2014.

EM12c Management Agent, OutOfMemoryError and Ulimits

$
0
0

While enjoying the lovely Liverpool, UK weather at Tech14 with UKOUG, (just kidding about that weather part and apologies to the poor guy who asked me the origin of “Kevlar” which in my pained, sleep-deprived state I answered with a strange, long-winded response…. :)) a customer contacted me in regards to a challenge he was experiencing starting an agent on a host that was home to 100’s of targets.

        oracle_database.DB301.com - LOAD_TARGET_DYNAMIC running for 596 seconds
        oracle_database.rcvcat11 - LOAD_TARGET_DYNAMIC running for 596 seconds
        oracle_database.DB302.com - LOAD_TARGET_DYNAMIC running for 596 seconds
        oracle_database.B303.com - LOAD_TARGET_DYNAMIC running for 596 seconds
        oracle_database.DB304.com - LOAD_TARGET_DYNAMIC running for 596 seconds
        oracle_database.DB305.com - LOAD_TARGET_DYNAMIC running for 596 seconds
        oracle_database.DB307.com - LOAD_TARGET_DYNAMIC running for 596 seconds
        oracle_database.DB309.com - LOAD_TARGET_DYNAMIC running for 596 seconds
        oracle_database.B311.com - LOAD_TARGET_DYNAMIC running for 596 seconds

Dynamic property executor tasks running
------------------------------


---------------------------------------------------------------
Agent is Running but Not Ready

The output from the “emctl start agent” wasn’t showing him anything he didn’t already know, but I asked him to send me the output and the following showed the actual issue that was causing the Agent not to finish out the run:

MaxThreads=96
agentJavaDefines=-Xmx345M -XX:MaxPermSize=96M
SchedulerRandomSpreadMins=5
UploadMaxNumberXML=5000
UploadMaxMegaBytesXML=50.0
Auto tuning was successful
----- Tue Dec  9 12:50:04 2014::5216::Finished auto tuning the agent at time Tue Dec  9 12:50:04 2014 -----
----- Tue Dec  9 12:50:04 2014::5216::Launching the JVM with following options: -Xmx345M -XX:MaxPermSize=96M -server -Djava.security.egd=file:///dev/./urandom -Dsun.lang.ClassLoader.allowArraySyntax=true -XX:+UseLinuxPosixThreadCPUClocks -XX:+UseConcMarkSweepGC -XX:+CMSClassUnloadingEnabled -XX:+UseCompressedOops -----
Agent is going down due to an OutOfMemoryError

This host target was a unique environment in that it contained so many targets, especially database targets.  One of the reasons that the management agent was created and OEM processing removed from an internal database back-end process was to lighten the footprint.  As EM12c introduced numerous features that has assisted its direction towards the center of the Oracle universe, the footprint became heavier, but I’ve been very impressed with development’s continued investment into lightening that footprint, even when considerable additions with plug-ins and metric extensions are added.

With all of this, the server administrator may have a different value set to limits on resource usage than what may be required for your unique environment.  To verify this, I asked the customer to run the following for me:

ulimit -Su
ulimit -Hu

Which returned the following expected values:

$ ulimit -Su
8192
$ ulimit -Hu
3100271

The user limit values with these added arguments are to locate the following information:

-H display hard resource limits.
-S display soft resource limits.

I asked him to please have the server administrator set both these values to unlimited with the chuser command and restart the agent.

The customer came back to confirm that the agent had now started, (promptly!) and added the remaining 86 database targets without issue.

The customer and his administrator were also insightful and correctly assumed that I’d made the unlimited values not indefinitely, but as a trouble-shooting step.  The next step was to monitor the actual resource usage of the agent and then set the limits to values that would not only support the existing requirements, but allocate enough of a ceiling to support additional database consolidation, metric extensions, plug-in growth.


Tags:  

Del.icio.us
Facebook
TweetThis
Digg
StumbleUpon


Copyright © DBA Kevlar [EM12c Management Agent, OutOfMemoryError and Ulimits], All Right Reserved. 2014.

EM12c and the Optimizer Statistics Console

$
0
0

Today we’re going to review another great feature in the EM12c that you may not have realized was available.  Once logged into a database target, click on the Performance menu and navigate to the Optimizer Statistics Console:

opt1

Optimizer Statistics Console Page

The new console page is clean, easy to navigate and has great access points to manage and monitor optimizer statistics for the given database target.

opt2

We’ll actually start at the bottom of the page with the Statistics Status and go up into the links.  Viewing the graph, you get a quick and clear idea of the status of your statistics for the database target you are logged into.  You can easily see if there are any stale stats that may be impacting performance and if there are any missing stats. You are shown how many objects are involved in the status category and can then move your way up into the links to review and manage your database statistics configuration.

Operations

opt4

View

We’re going to go through the Operations by order of logic and not by order in the console, so we’ll start with View.

This link will take you to a great little report console that will display information about statistics in the database.  Even though our example will display results for Stale statistics, note the other great filters for the report:

opt13

As we want to see everything, we’re not going to choose any other filters for our report until we get to the bottom and have the options of Current, Pending or All for our Scope We’re going to change it to All considering the version of database is 11.2.0.4 and we could have pending statistics waiting to be implemented.

opt14

The report quickly showed that both data dictionary and fixed objects were stale, (schemas are up to date!) so we could multi-select objects on the left of the report and gather stats, (along with other options) or we could use the next section we’ll be covering to gather those stats in an EM job and address the stale statistics issue in what I feel, is a more user friendly interface.

Gather

Back in the Optimizer Statistics Console, we can click on the Gather link, you will be taken directly to the Gather Statistics Wizard:

opt5

There is a clear warning at the top letting you know that as of DB11g, automated maintenance tasks should be enabled to gather nightly statistics.  This is turned on by default in most databases, so this warning is a nice addition to this page for those that may not be aware.

Below this warning, you are able to choose what level of statistics gathering you wish to perform, (database, schema, objects, fixed objects or data dictionary…)

By default, Oracle’s guidelines for statistic collection options will be chosen, but you can change this to customize if you wish to work outside of Oracle’s recommendations.  You can view the default values before deciding and if for some reason, you wish to use manual configuration options:

opt6

The wizard won’t ask you to set the manual configurations until later into the setup steps and if you change your mind, you can still choose the defaults.

At the bottom of the wizard, you also have the opportunity to use the Validate with the SQL Performance Analyzer,  but as noted, the changes won’t be published and you’ll have to do that manually post the statistics collection run.

The next page will take you through the customizes options you want to use instead of GATHER AUTO, (although, like I said, you could just leave it as is and have it just perform the default anyway! :))

opt7

Then you get to schedule it via the EM Job Service and would monitor and manage this job via the EM12c Job Activity console.

opt8

This means that this is not an automated maintenance task in the Database Job Scheduler and if you are not aware of how to view jobs via the DBMS_JOB_SCHEDULER, then you could have two stats jobs running for a database or even worse, simultaneously, so BE AWARE.

Lock/Unlock/Delete

As the Lock, Unlock and Delete links take you to similar wizards that do just the opposite action, we’ll group them together in one section.  Using the Unlock statistics wizard in our example, you can click on the link and choose to unlock a schema or specific tables:

opt9

If you decide to unlock just a few or even just one object, the wizard makes it quite easy to search and choose:

opt10

In the example above, I clicked on the magnifying glass next to the box for the Schema and then chose the DBSNMP schema.  I can use a wild card search in the object name box or leave it blank and all tables in the schema are returned and a simple click in the box to the left of the object name will select it to lock, delete or unlock it, (depending which wizard you’ve chosen…)  You also can view information on IF the object is locked or unlocked already, along with partitioning information, as you may have partitions that are locked while the table may not be.

Restore

The restore option is a great feature for those that may not be on top of their “restore statistics syntax on the top of their head” game.  Now, I have to admit, some of the options in this wizard makes me very nervous.  The idea that someone would dial back database level statistics vs. locating the one or two offenders that changed just seems like throwing the baby out with the bath water, but it is an option in the restore statistics command, so here it is in the wizard, as well.

opt11

You have the option to override locked objects and force a restore, too.  Like with locking and unlocking objects, the next screen in the wizard will allow you to choose a schema and object(s) that you wish to restore from and then once chosen, you will be asked when to restore to, including the earliest restore timestamp available:

opt12

Post these choices, you then schedule the EM Job to run the task and you’re set.

 Manage Optimizer Statistics

opt3

You must be granted the Create Job and Create Any Job privileges to take advantage of these features and will be warned if you haven’t been granted one or both.

Operations links include the ability to Gather Optimizer Statistics, which includes database and schema level, along with distinct object level.  Secondary links to restore, lock, unlock and delete statistics for each statistics gathering type is available as well.

Related Links

The Related Links section includes links for research and configuration settings, such as current object statistics, global statistic gathering options, the job scheduler to view current intervals for jobs involving statistics as well as automated maintenance tasks which inform you of any clean up and maintenance jobs that are part of the overall Cost Based Optimizer world.

Configure

opt15

These links will configure the Automated Maintenance Tasks, allowing you to update schedules of execution, disable/enable and work with SPA results, (SQL Performance Analyzer.)

opt16

If you haven’t used SPA yet, it has some pretty cool features allowing you to simulate and analyze different performance changes before you make them.  Nothing like being able to see in the future!

Working with some of these features may require a few management packs, (tuning, real application testing, etc.) but if you’re curious if you’re wandering into a new management pack land, it’s easy to locate from any EM12c console page:

opt17

You will receive information about any management packs involved with the features you are using in the EM12c console for the page you’re on:

opt18

So embrace the power with optimizer statistics in EM12c Cloud Control and if you want to know more about managing Optimizer Statistics click here for the Oracle documentation or this whitepaper for more info.


Tags:  

Del.icio.us
Facebook
TweetThis
Digg
StumbleUpon


Copyright © DBA Kevlar [EM12c and the Optimizer Statistics Console], All Right Reserved. 2014.

2014 Year in Review

$
0
0

As many bloggers and sites do this time of the year, here is my review of 2014. It was a great year and it was a lot of fun, as well as educational reviewing all the data.

DBAKevlar Blog

Busiest Day on my Blog:

posts5

Posts this year:

Posts1

Most popular post of 2014:  Easy EM12c Agent Deployment on Windows

posts6

Windows installations are still a huge mystery and Cygwin still frustrates a lot of people, sometimes, me included.  This post describing the easiest deployment method has continued to be my most popular post.  I admit that I’m not too thrilled that it is attained via a search engine after typing in “DBAKevlar + Easy” though… :)

Pingbacks

If you aren’t familiar with the term, it is when someone links to one site to another.  Right now, I believe Pete Sharman owes me a beer, (or a few) for the 100’s of redirects to his site my blog generates… :)

posts8

Most individual blogger pingback: Brian Pardy. In the last 90 days, he’s referred others to my site 146 times, second is Jeff Smith with 51 times and Bobby Curtis with 46. Nice going Brian-  Could you give Pete some lessons? :D

Searches

Obviously I’ve missed my calling to be a reviewer of tech products, which can be seen by search engine overload:

posts7

I’ve known for some time that there isn’t enough data to market smartwatches to women, which is proven by the searches that bring people to my blog.  Figure it out, tech wearables… :)

Speaking

This year I spoke at 11 conferences.

I did 4 joint-keynotes with my husband, Tim Gorman and an Empowerment keynote for NWOUG, for a total of FIVE keynotes in 2014.

I lead 5 Women in Technology Panels and picked up 12 new individuals to mentor from those events.  I am very impressed with all their contributions to technology and their growth in the industry!

Two Social Media sessions-  teaching folks how to use Social Media instead of the same old discussion of “you should be using”.  Looking forward to the RMOUG 2015 session with Jeff Smith coming up in February!

An IOUG Master Class at Coors Field!  This was a great event and I thoroughly enjoyed this!  Great group, great co-speakers.  It was well planned and well attended, not to mention enjoying the game after the event!

Webinar with ODTUG on the AWR Warehouse.

Slides

I’ve uploaded 19 slide decks to Slideshare.  Enterprise Manager, ASH/AWR and Women in Technology is the topic in focus and although a slide deck is a poor excuse vs. seeing a presentation, there is still a good amount of valuable data in each of the uploaded presentations.

Publications

Books

The Enterprise Manager 12c Command Line Interface book from Apress was released!

Articles

Oracle Magazine: Making a Change

NoCOUG: Women in Tech

Oracle Scene: Database as a Service in a DBA’s World

IOUG Member Spotlight

IOUG Ask an Oracle ACE

RMOUG:  Social Media for the Techie

IOUG Select Magazine: New Features in EM12c Release 4, (with Pete Sharman)

Denver Business Journal: Not Playing it Safe

UKOUG Women in Tech Initiative

Denver Post:  TechKnowsByte

O’Reilly Press, Thanks to Steven Feuerstein:  Celebrating Ada Lovelace Day

Awards

There were a few awards through out the year-

2014 Volunteer of the Year award for RMOUG.

November 2014 Oracle Pro from Dell/Toad

The big one of course was being recognized by the Colorado Technical Association as their Women in Technology APEX Award winner for 2014.  I was in no way prepared for this, as I was sure another finalist was the definitely the one they would call on stage.  I’m told I gave a great acceptance speech, so if anyone does have it on tape, I’d love to know what I said up there.  All I remember was trying to keep my legs from shaking up at the podium… :)

Personal

Its been a pretty big year personally, too.  My oldest son, Sam moved out of the house and is on his own.  He just turned 20 and it’s difficult to believe that my oldest child was born two decades ago.  His sister Cait has recently dyed her hair a lovely shade of purple and is finishing up her senior year in high school.  My baby, Josh is now a freshman in high school and just found out that those baby blues of his will need glasses.

The biggest news of the year is that my best friend and partner in this world, Tim Gorman and I got married October 5th.  After happily traveling around the world together, working on conferences, user groups and in similar technical arenas, we are now recognized by the government as partnered, too… :)

2015 Goals

Oracle Enterprise Manager Webinars-  This has been on hold way too long and I need to get them started.  Monthly webinars on EM12c topics and interviews!

RMOUG Training Days 2015-  Yeah, I’m the Conference Director again this year and it’s shaping up to be an AMAZING conference.  I took some time to talk about some of the new items on the 2015 agenda in this post, but keep an eye out, there’s more to come!

Speaking-  I’m currently set to speak at HotSos Sym 2015, OUGN, RMOUG, IOUG Collaborate, GLOC and?  Is your conference on my list?  Let me know if I need to submit an abstract and I would love to visit a few new locations this year to spread the word about Enterprise Manager, Women in Technology and other great Oracle topics!

Another Book?  I think I owe Leighton Nelson an apology, as I still haven’t started to collect myself on a book topic he wants us to start working on….sigh…

STEM and Women Empowerment Initiatives-  I will be working with CTA and powerful women in the industry to empower and inspire those around us to build their future in technology.

Articles-  I’m in the midst of writing an article on the AWR Warehouse now and will be writing a lot of articles for 2015.  I look forward to showing folks how much the Enterprise Manager 12c product can do and how much they have to look forward to in upcoming releases!


posts9

                                                fireworks-3

Well, it’s been a blast of a year and to close, I wish everyone a Happy New Year and a great 2015!


Tags:  ,

Del.icio.us
Facebook
TweetThis
Digg
StumbleUpon


Copyright © DBA Kevlar [2014 Year in Review], All Right Reserved. 2015.

Why Automate Target Patching with Enterprise Manager 12c

$
0
0

Every job comes with tasks that no one likes to perform and database administration is no exception.  Patching is one of those necessary tasks that must be performed and when we are expected to do more with less everyday, the demands of patching another host, another agent, another application is often a task that no one looks forward to.  It’s not that it goes wrong, but that it’s just tedious and many DBAs know there are a lot of other tasks that could be better use of their time.   Patching is still an essential and important task that must be performed, we all know that. OPatch and other patching utilities from Oracle make patching easy, but it can still remove a lot of time from a resource’s day.

Enterprise Manager 12c’s automated patching and provisioning, using the Database Lifecycle Management Pack is gaining more appreciation from the IT community as it assists the DBA with features to search recommended patches, create patch plans, review for conflicts and allow sharing and re-use of patch plans.

Configuring a Database for Online or Offline Patching

After logging into a target database, you can click on Setup and go to the Offline Patching setup:

patching22

You can then choose to use Online patching with MOS credentials:

patching1

or use Offline Credentials and configure the patching catalog and ensure you upload all the XML’s for the catalog, which will now be stored locally to a workstation.  Once the upload is complete, run the Refresh From My Oracle Support job.

patching2

The Online configuration is recommended and works with the software library.  It’s what we’ll be talking about today.

Also ensure that you’ve set up correct privileges to perform patching. Provisioning and patching require steps to be performed that will require privileges to run root scripts, so ensure that the credentials that are used for the patching allow to sudo to root or PBrun.

Database Patch Plans

To set up a patch plan for a database, there are a number of steps, but the patch plan wizard makes this very easy to do.  For our example, we’ll choose to patch 11.2.0.4 databases to the latest recommended patches.

First, let’s do a search to find out what patches we’ll need to apply to our 11.2.0.4 databases in our EM environment.

patching3

Our Enterprise menu takes us to the Provisioning and Patching, Patches and Updates.

From this console page, we can view what patch plans are already created in case we can reuse one:

patching4

As there isn’t an existing plan that fits what we need to do, we are going to first search for what patches are recommended with the Recommended Patch Advisor:

patching10

We’ve chosen to perform a search for recommended patches for 11.2.0.4.0 databases on Linux x86-64.  This will return the following four patches:

patching11

We can click on the first Patch Name, which will take us to the patch information, including what bugs are addressed in this patch, along with the option to download or create a patch plan.  For the purpose of this post, we’ll choose to create a patch plan:

patching12

We’ll create a new patch plan for this, as our existing ones currently do not include an 11g database patch plan that would be feasible to add to.  We can see our list of patches on the left, too, so this helps as we proceed to build onto our patch plans.

After clicking on the Add to New, we come to the following:

patching13

Name your patch plan something meaningful, (I choose to name the patch for a single instance, “SI”, the patch number and that it’s for 11.2.0.4) and then choose the database from the list you wish to apply the patch to.  You can hold down the CTRL key and choose more than one database and when finished, click on Create Plan.

The patch plan wizard will then check to see if any other targets monitored by Cloud Control will be impacted and asks you to either add them to the patch plan or to cancel the patch plan for further investigation:

patching14

If you are satisfied to with the additions, you can click on Add All to Plan to proceed.  The wizard then checks for any conflicts by the additions and will report them:

patching15

In our example above, I’ve added an 11.2.0.3 instance home to show that the wizard notes it and offers to either ignore the warnings and add it or (more appropriately) cancel the patch plan and correct the mistake.

Adding to Patch Plans

In our recommended patch list, we had four recommended patches.  Once we’ve created our first patch plan, we can now choose to add to it with the subsequent patches from the list:

patching16

This allows us to create one patch plan for all four patches and EM will apply them in the proper order as part of the patch deployment process.

Patch Plan Review and Deploy

One a patch plan is created, the next step is to review and deploy it.  Choose the patch plan from the list that we created earlier:

patching18

Double clicking on it will bring up the validation warning if any exist:

patching17

We can then analyze the validations required and correct any open issues as we review the patch plan and correct them before deploying:

patching29

We can see in the above checks, that we are missing credentials required for our patches to be successful.  These can now be set by clicking to the right of the “Not Set” and proceed with the review of our patch plan.

patching20

Next we add any special scripts that are required, (none here…) any notification on the patching process so we aren’t in the dark while the patch is being applied, rollback options and conflicts checks.

These steps give the database administrator a true sense of comfort that allows them to automate, yet have notifications and options that they would choose if they were running the patch interactively.

Once satisfied with the plan, choose the Deploy button and your patch is now ready to scheduled.

patching21

Once the patching job completes or if it experiences an issue and results in executing the logic placed in the above conflict/rollback steps, the DBA can view the output log to see what issues have occurred before correcting and rescheduling.

Output Log 
Step is being run by operating system user : 'ptch_em_user' 
 
Run privilege of the step is : Normal  

This is Provisioning Executor Script
…
Directive Type is SUB_Perl
…
The output of the directive is:
…
Tue Jan 6 00:15:40 2015 - Found the metadata files; '19121551' is an patch
…
Tue Jan 6 00:15:40 2015 - OPatch from '/u01/app/oracle/product/11.2.0/dbhome_1/OPatch/opatch.pl' 
  will be used to apply the Interim Patch.
…
Tue Jan 6 00:15:52 2015 - Invoking OPatch 11.2.0.4.7
…
Following patches will be rolled back from Oracle Home on application of the patches in the given list :
   4612895
…
Do you want to proceed? [y|n]
Y (auto-answered by -silent)
User Responded with: Y
OPatch continues with these patches:  6458921  

Do you want to proceed? [y|n]
Y (auto-answered by -silent)
User Responded with: Y

Running prerequisite checks...

This is high level, but really, it’s quite easy and the more you automate provisioning and patching, the easier it’ll get and you’ll wonder why you waited so long!


Tags:  , ,

Del.icio.us
Facebook
TweetThis
Digg
StumbleUpon


Copyright © DBA Kevlar [Why Automate Target Patching with Enterprise Manager 12c], All Right Reserved. 2015.
Viewing all 63 articles
Browse latest View live